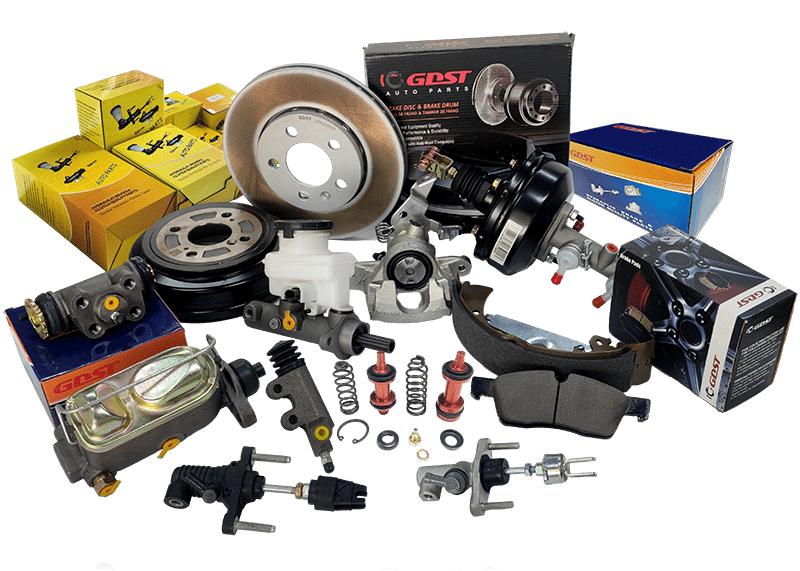
Brake caliper market trends 2027 can create a planning problem for aftermarket buyers because broad forecasts rarely show which applications will sell in a specific territory. If buyers follow headlines alone, they can add slow-moving SKUs while missing local demand. I recommend translating each trend into regional coverage, inventory, quality, and supplier-risk decisions.
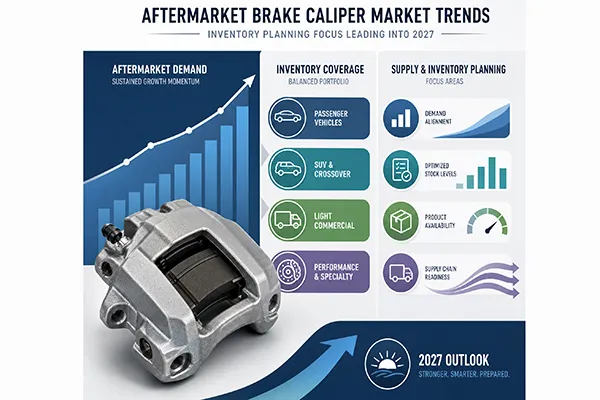
Brake caliper market trends for 2027 point toward more regionalized demand planning, closer scrutiny of effective application coverage, greater attention to total procurement risk, and measured preparation for electrification. Buyers should use local vehicle population, sales velocity, stockout, warranty, and inventory-turnover data rather than treating any global forecast as a universal purchasing plan.
In our buyer inquiries, production planning, and customer projects, we have repeatedly observed that the same market trend can produce different purchasing decisions across regions. I will explain how importers, distributors, category managers, and private-label brands can convert broad market signals into practical SKU and supplier plans.
Why Will Regional Demand Shape Brake Caliper Market Trends 2027?
Global market headlines can make expansion look simple. However, a range that performs well in one country may move slowly in another. When buyers overlook local vehicle populations and repair patterns, they can lock working capital into the wrong brake calipers and still experience stockouts on priority applications.
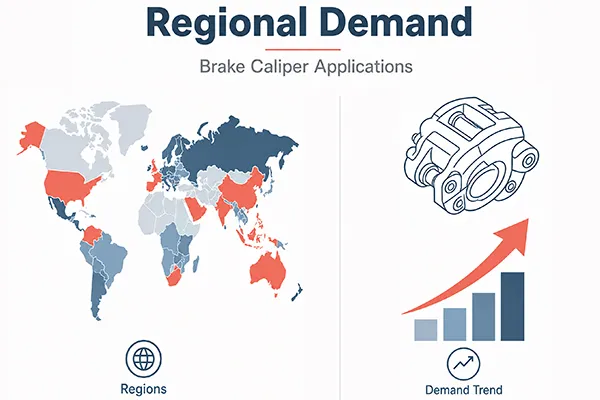
Regional demand will shape brake caliper market trends 2027 because aftermarket sales depend on the vehicles actually in operation, their age, application mix, repair frequency, and local purchasing behavior1. I recommend comparing these factors with internal sales velocity, lost-sales records, stockouts, and inventory turnover before adding or removing any SKU.
I Start With Vehicles in Operation, Not a Global Headline
I treat market forecasts as background information rather than a purchasing instruction. A forecast may indicate growth in a broad brake component category, but it does not identify the exact OE applications that a distributor should stock in São Paulo, Warsaw, Johannesburg, Dubai, or Jakarta.
I prefer to begin with the local vehicles in operation. The analysis should consider:
- Vehicle makes and models: I identify the dominant passenger cars, light commercial vehicles, and relevant heavy-duty applications.
- Model years: I separate newer vehicles from aging vehicles that have entered the main repair cycle.
- Powertrain mix: I distinguish internal-combustion, hybrid, and battery-electric applications where the braking hardware differs.
- Geographic concentration: I check whether an application is common nationwide or concentrated in a particular city or commercial fleet.
- Repair environment: I consider climate, corrosion exposure, road conditions, maintenance practices, and parts availability2.
- Existing competition: I review which applications already have heavy price competition and which have persistent supply gaps.
A national vehicle-registration database, reputable vehicle-in-operation dataset, or regional parc report can support this analysis. I would verify the date, geographic coverage, vehicle classification, and methodology before relying on any external dataset.
I Compare Market Potential With Actual Sales Behavior
Vehicle population does not automatically equal immediate demand.3 A common vehicle can still generate weak sales if its calipers are rarely replaced, if repair shops prefer remanufactured units, or if another distribution channel dominates the application.
I use a demand scorecard to connect external market information with internal performance:
| Evaluation factor | Question I ask | Practical purchasing use |
|---|---|---|
| Vehicles in operation | How many relevant vehicles remain active locally? | I estimate the potential demand base. |
| Vehicle age | Are vehicles entering a repair-intensive period?4 | I prioritize mature aftermarket applications. |
| Monthly sales velocity | How quickly does each SKU leave inventory? | I set replenishment frequency and stock depth. |
| Stockout frequency | Are lost sales caused by insufficient stock? | I identify understocked priority references. |
| Inventory turnover | How long does stock remain unsold? | I reduce excess capital in slow movers. |
| Warranty history | Does the application create repeat claims? | I review quality, fitment, and catalog data. |
| Lead time | How quickly can the supplier replenish stock? | I calculate safety-stock requirements. |
I have seen buyers become interested in a large application range because it appears to support growth. After the buyer reviews actual sales, however, a smaller group of priority SKUs often produces most of the immediate opportunity5. That observation is not a universal market rule, but it is a useful reason to validate any range expansion with customer-specific data.
How Should Buyers Evaluate Coverage in Brake Caliper Market Trends 2027?
A large OE-reference count can appear reassuring, but the headline number can hide important weaknesses. If the references do not match local vehicles, contain catalog errors, or lack available inventory, the buyer can still lose sales and create fitment disputes despite purchasing from a supplier with a broad catalog.
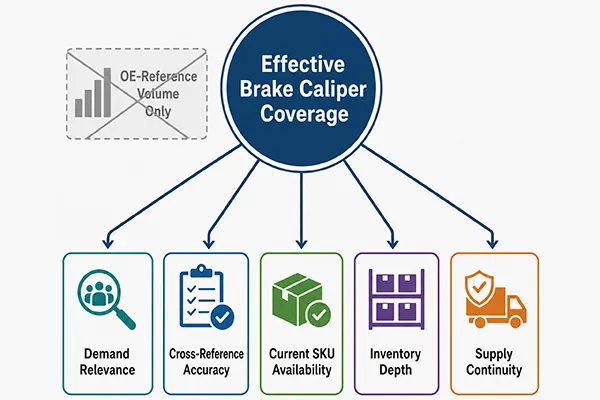
I define effective brake caliper coverage as the share of commercially relevant applications that a supplier can identify accurately, produce consistently, keep available, and replenish reliably. Buyers should assess demand relevance, cross-reference accuracy, current SKU availability, inventory depth, and continuity of supply instead of using OE-reference volume as the only measure.
I Separate Catalog Breadth From Commercial Relevance
A catalog may include thousands of references, but not every reference has equal value to a regional distributor. Some applications may be obsolete, extremely slow moving, duplicated through multiple cross-references, or irrelevant to the target vehicle population.
I recommend dividing a proposed range into four groups:
- Core applications: I classify proven, high-velocity references with strong local demand in this group.
- Coverage applications: I include lower-volume references that help a distributor offer a credible category range.
- Growth applications: I place emerging vehicle applications here when external fleet data and customer inquiries support future demand.
- Tail applications: I treat rare or uncertain references carefully because they can absorb inventory capital for long periods.
This classification helps me discuss meaningful coverage without assuming that every listed OE number deserves equal stock depth. It also gives buyers a clearer basis for minimum order quantities, mixed-SKU orders, replenishment schedules, and safety stock.
I Audit Catalog Accuracy Before Expanding Inventory
Catalog errors can create costs beyond the value of the product. An incorrect cross-reference can lead to a return, installation delay, customer complaint, or warranty investigation.6 Buyers should therefore verify application data before placing a large initial order.
My coverage audit normally includes the following checks:
- I compare the OE number, aftermarket cross-references, and vehicle application.
- I verify the axle position, left or right side, and caliper type.
- I confirm piston dimensions, mounting configuration, and relevant hardware.
- I review product photographs, technical drawings, and packaging labels.
- I check whether the supplier applies a clear revision-control process.
- I request sample inspection for commercially important or technically uncertain references.
- I confirm whether superseded numbers and regional application differences are documented.
I Measure Whether the Coverage Is Available
Effective coverage also depends on supply reality. A reference that exists only in a spreadsheet does not help a distributor fulfill an urgent customer order.
| Coverage measure | Weak interpretation | Stronger interpretation |
|---|---|---|
| OE-reference count | “The supplier lists many numbers.” | I verify how many references match target demand. |
| SKU availability | “The product has been developed.” | I confirm current production or stock status. |
| Inventory depth | “The SKU can be supplied.” | I verify realistic quantity and replenishment time. |
| Catalog quality | “A cross-reference exists.” | I validate fitment details and revision control. |
| Supply continuity | “The first order is available.” | I assess repeat-order capacity and material planning. |
GDST’s supplied business context includes more than 5,000 OE references, but I would not ask a buyer to treat that number alone as proof of market suitability. I would map the available range against the buyer’s target applications and verify samples, documentation, lead times, and continuity before the buyer commits to a broader purchasing program.
Why Is Supplier Risk Central to Brake Caliper Market Trends 2027?
A low quotation can look attractive when buyers compare suppliers in a spreadsheet. However, inconsistent machining, delayed deliveries, inaccurate catalogs, or weak claim support can quickly erase an initial saving. The buyer then carries the cost through returns, emergency replenishment, damaged relationships, and unavailable stock.
Supplier risk is central to brake caliper market trends 2027 because buyers increasingly need to compare total procurement cost rather than unit price alone7. I include quality consistency, warranty exposure, lead-time reliability, supply continuity, documentation, customization, communication, and technical support when evaluating the commercial value of a brake caliper supplier.
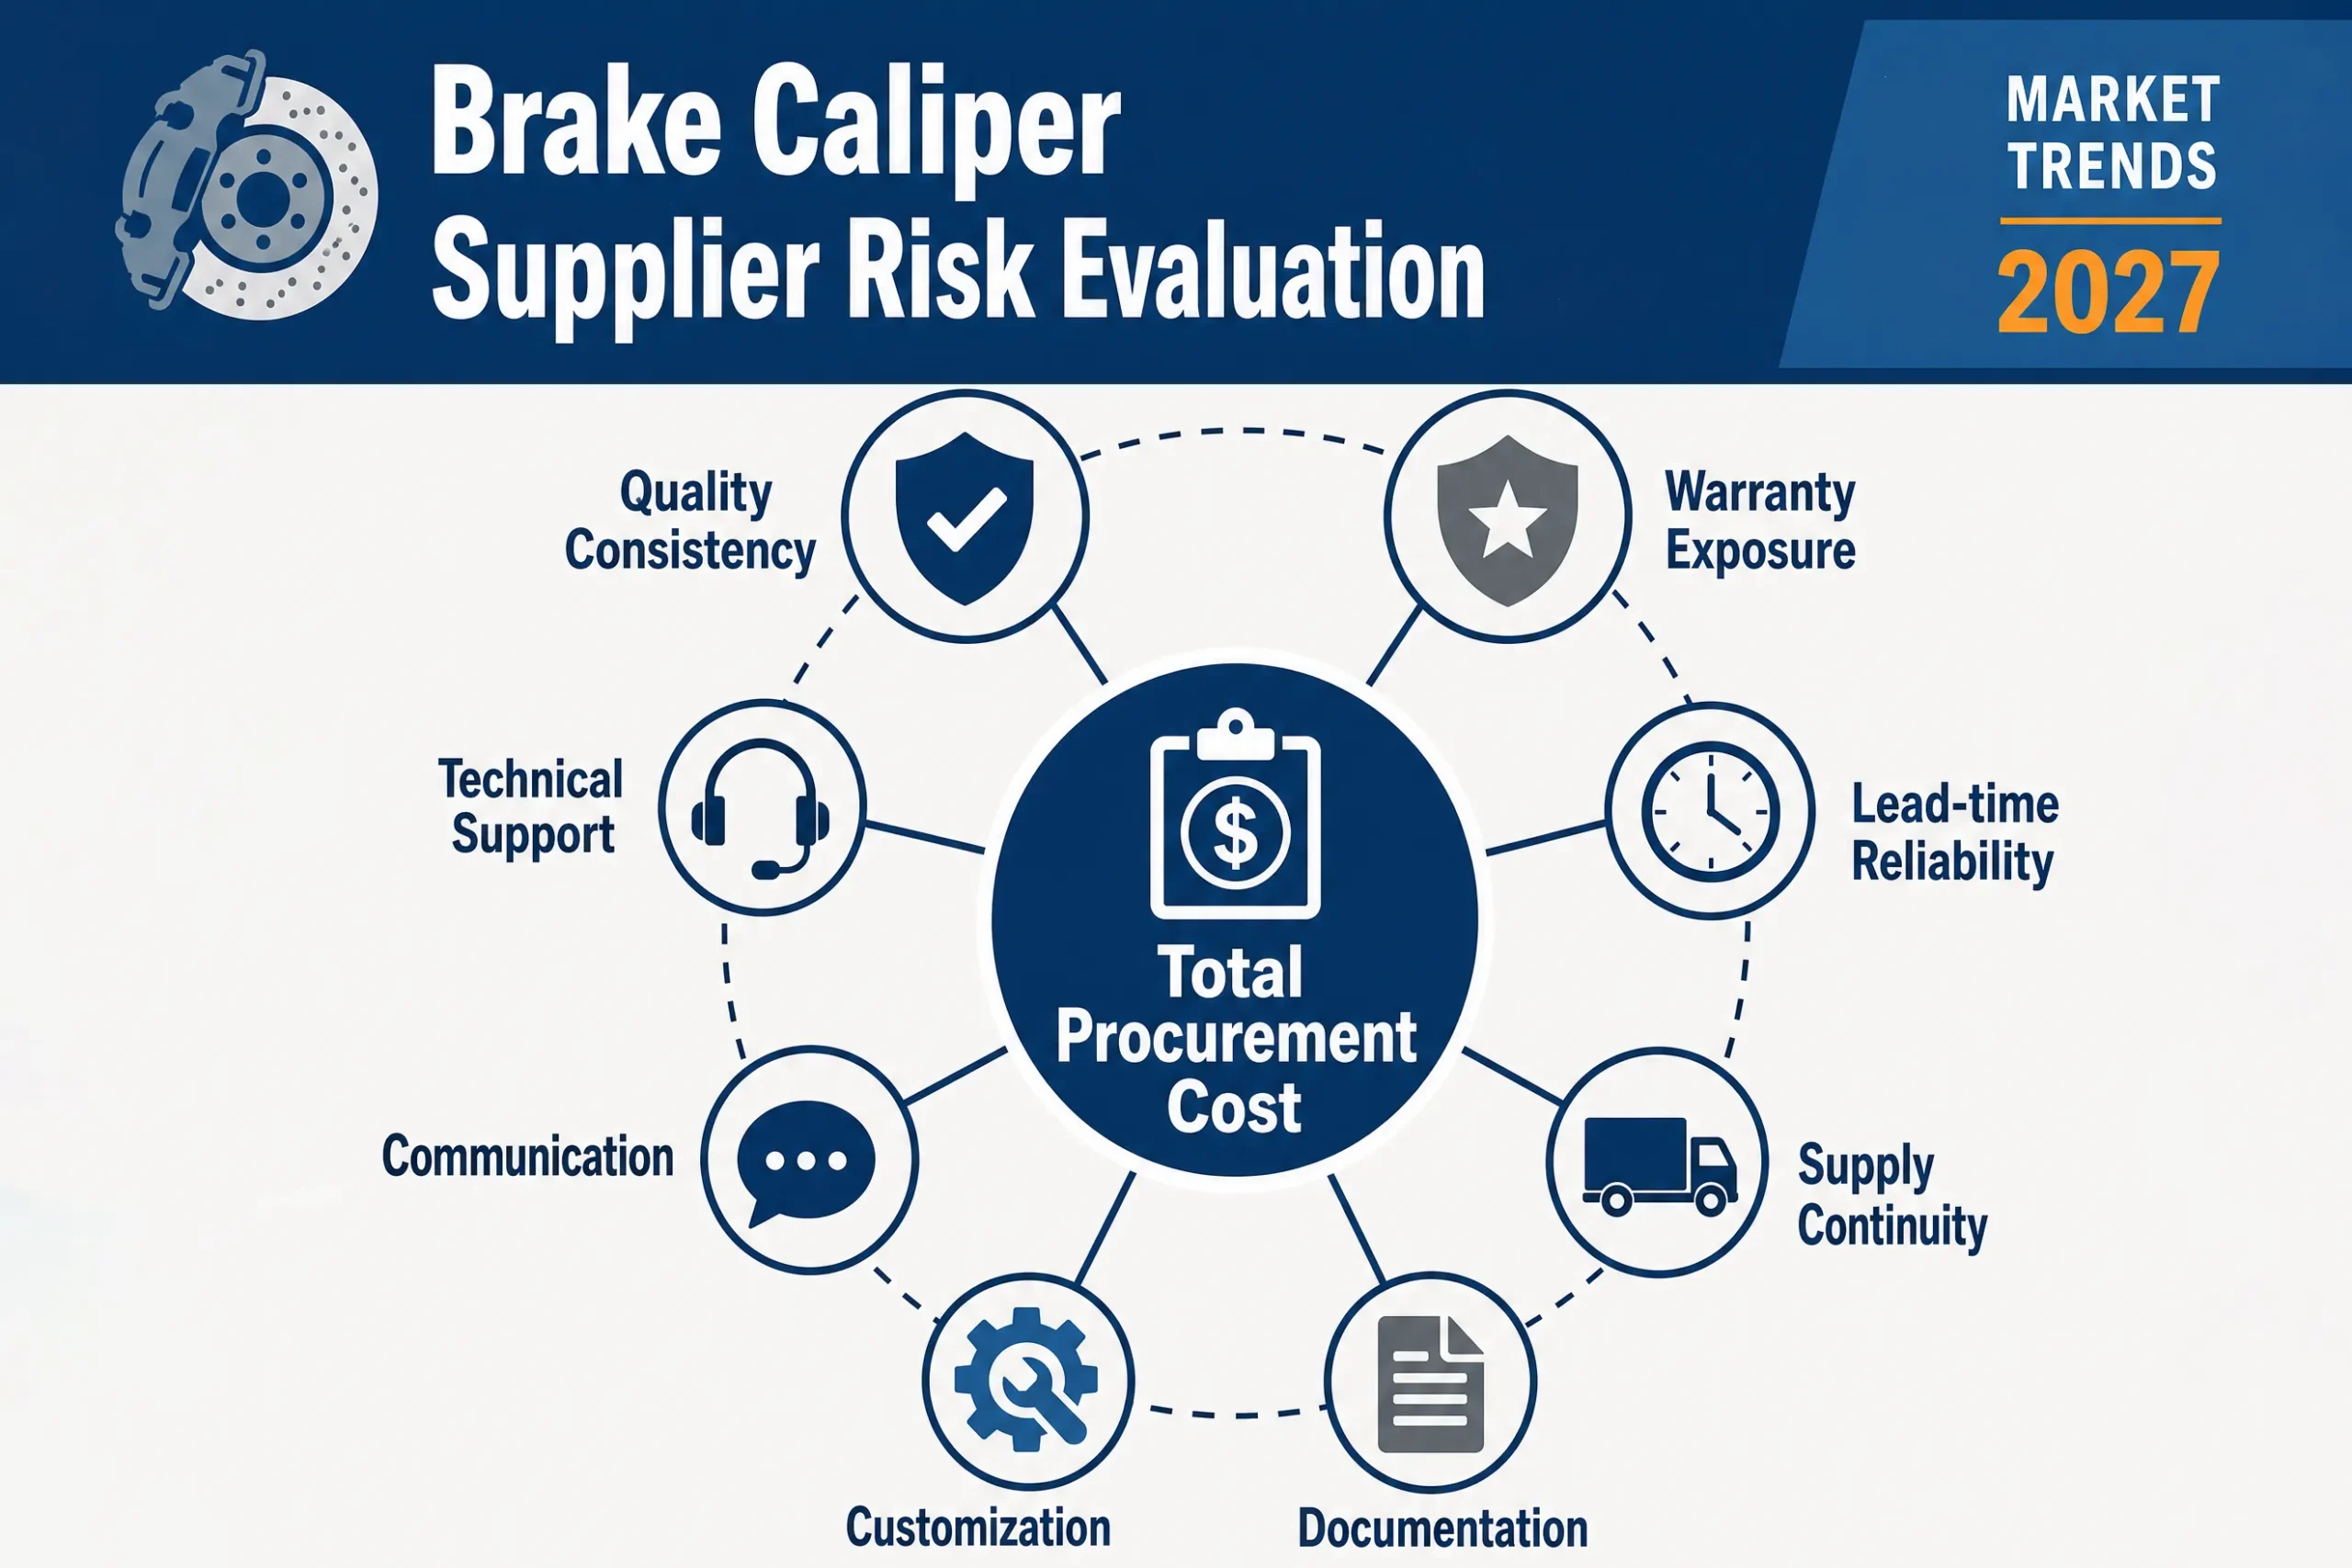
I Build a Total Procurement Risk Model
I do not dismiss price. Price remains important for distributors that compete in cost-sensitive aftermarket channels. However, I place unit price inside a broader cost model.
A practical model can include:
Total procurement exposure = purchase cost + logistics cost + inspection cost + inventory cost + warranty cost + stockout cost + administrative cost
Some costs are easier to measure than others. A buyer can usually calculate freight, customs charges, inspection expenses, and inventory carrying costs. Stockout losses and reputational damage are harder to quantify, but they should not be treated as zero.8
I recommend tracking several supplier performance indicators:
- I track the accepted quantity against the inspected quantity.
- I record claims by SKU, production batch, and failure description.
- I compare confirmed lead time with actual delivery performance.
- I measure complete and on-time shipment rates.
- I review the response time for technical and warranty questions.
- I record packaging, labeling, and documentation errors.
- I monitor whether repeat orders remain consistent with approved samples.
I Verify Quality Systems Rather Than Accepting a Logo
A quality-management certification can support a supplier evaluation, but a certificate is still a document that the buyer should verify.9 The buyer should check the certificate’s issuing body, validity period, scope, site address, and covered activities. The buyer should also assess whether daily production controls reflect the documented system.
The supplied business context states that GDST operates under IATF 16949:2016 certification. I recommend that buyers verify the current certificate and scope directly during due diligence. Buyers should also request process evidence relevant to their selected products.
A brake caliper supplier assessment may include:
- Incoming inspection: I check how the factory verifies castings, seals, pistons, guide components, and other purchased materials.
- Machining control: I review how the factory controls dimensions, tool wear, fixtures, and CNC process consistency.
- In-process inspection: I ask which characteristics receive routine checks and how results are recorded.
- Performance testing: I verify the test methods, sampling plan, equipment status, and acceptance criteria.
- Traceability: I confirm how batches connect materials, production records, inspection results, and finished goods.
- Nonconformance control: I review how the supplier contains, investigates, and corrects a production issue.
- Change management: I ask how the supplier communicates material, process, tooling, or sub-supplier changes.
For application-specific safety, compliance, or failure-analysis decisions, I recommend using qualified engineers, testing laboratories, or automotive quality professionals. A commercial supplier discussion should not replace independent technical evaluation where the risk requires it.
How Will Electrification Affect Brake Caliper Market Trends 2027?
Electrification can lead buyers toward two opposite mistakes. Some buyers may ignore new EV applications, while others may cut conventional coverage too quickly. Both approaches can create inventory gaps because vehicle-fleet transitions occur at different speeds across countries, segments, and customer channels.
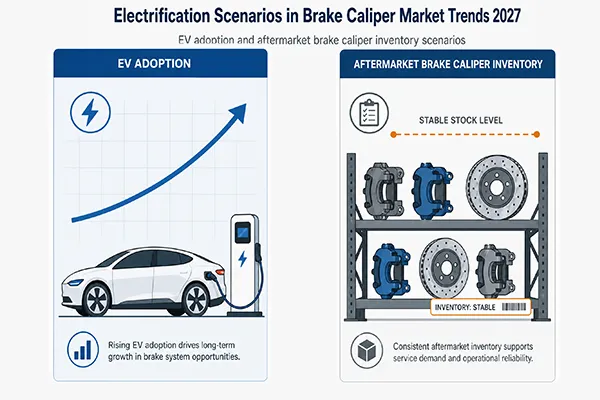
Electrification will affect brake caliper market trends 2027 through gradual changes in vehicle populations, braking-system designs, replacement behavior, and application demand. I recommend scenario planning that considers regional EV adoption, the existing combustion-engine fleet, hybrid growth, vehicle age, and verified sales data before changing conventional or electric-vehicle caliper inventory.
I Avoid a Simple Replacement Narrative
Battery-electric vehicles use friction brakes alongside regenerative braking10, but the configuration and aftermarket implications vary by platform. Regenerative braking can change how often friction components operate.11 At the same time, reduced use does not remove the need to inspect braking components for corrosion, movement, sealing condition, and application-specific wear12.
I would not apply one generalized replacement-rate claim to all electric vehicles. Climate, road salt, driving conditions, vehicle design, maintenance behavior, and local inspection rules can all influence service demand. Any technical forecast should come from a traceable engineering or fleet source and should be verified for the relevant vehicle population.
The existing internal-combustion fleet also remains important. New-vehicle sales do not instantly replace vehicles already operating on the road. I therefore compare new registrations with total vehicles in operation and average vehicle age before changing conventional caliper coverage.
I Use Three Inventory Scenarios
I find that a scenario table helps buyers discuss electrification without pretending that one forecast will fit every market.
| Regional scenario | Indicators I would monitor | Possible inventory response |
|---|---|---|
| Slow EV transition | The region has limited charging access and a large aging conventional fleet. | I would protect core conventional coverage and monitor emerging EV references. |
| Mixed transition | The region shows growth in hybrids and EVs while older vehicles remain active. | I would maintain conventional depth and add selected validated applications. |
| Faster urban transition | Major cities show concentrated EV registrations and fleet adoption. | I would prioritize relevant urban applications without assuming national demand. |
I would require evidence before assigning a region to any scenario. Useful sources may include government registration data, vehicle-in-operation reports, fleet disclosures, charging-infrastructure records, and the buyer’s own inquiry history. Any stated 2027 EV adoption percentage or regional forecast should have a named source, publication date, methodology, and geographic definition.
I Use Purchase Triggers Instead of Guesswork
I recommend creating clear triggers for adding an EV or hybrid caliper SKU. A buyer might require:
- I would look for a minimum number of repeated customer inquiries.
- I would verify a meaningful local vehicle population.
- I would confirm accurate application and cross-reference data.
- I would assess sample availability and validation requirements.
- I would obtain a workable lead time and minimum order quantity.
- I would define an initial stock level that limits overexposure.
- I would review sales after a fixed trial period.
This approach allows a distributor to prepare for changing brake technology while protecting working capital. It also recognizes that electrification is a regional and application-level development, not an immediate global replacement event.
Frequently Asked Questions
What is the most important brake caliper market trend for 2027?
I consider regional demand planning the most important trend for aftermarket buyers. Global growth projections provide context, but local vehicles in operation, vehicle age, application mix, sales velocity, stockouts, and turnover provide a stronger basis for deciding which brake caliper SKUs to stock.
How should I evaluate a brake caliper supplier’s OE coverage?
I would map the supplier’s references against the target region’s priority vehicles. I would then verify catalog accuracy, product availability, inventory depth, lead time, repeat-order continuity, and technical documentation. A large reference count has limited value when commercially important applications are inaccurate or unavailable.
Should distributors reduce conventional brake caliper inventory because of EV growth?
I would not reduce conventional inventory based on EV headlines alone. I would examine the existing vehicle fleet, average vehicle age, regional EV adoption, sales history, and customer inquiries. A staged scenario plan usually carries less risk than a sudden range reduction.
Which supplier documents should a brake caliper buyer verify?
I would verify the quality-management certificate, business and manufacturing details, inspection records, test documentation, traceability practices, product specifications, and application data. I would also confirm the certificate’s issuer, validity, site, and scope rather than relying only on a logo in a sales presentation.
How can I calculate the right brake caliper stock depth?
I would combine historical sales velocity, demand variability, replenishment lead time, supplier delivery performance, and target service level. I would keep deeper stock for proven high-velocity applications and use controlled trial quantities for uncertain or emerging SKUs. The final method should reflect the buyer’s cash-flow and customer-service requirements.
Conclusion
Brake caliper market trends 2027 should guide questions rather than dictate universal purchasing decisions. I recommend that buyers connect external forecasts with local vehicle populations, SKU-level sales, stockouts, inventory turnover, catalog accuracy, supply continuity, and total procurement risk. Electrification also requires regional scenarios instead of a simple replacement assumption. If you are evaluating brake caliper coverage for your market, GDST can help you review target OE applications, documentation, customization needs, and supply requirements before you build a purchasing plan.
"Auto Care Factbook - Automotive Aftermarket Industry ...", https://www.autocare.org/data-and-information/market-research/Auto-Care-Factbook. Automotive-aftermarket research identifies vehicles in operation, fleet age, vehicle composition, and maintenance or repair patterns as important determinants of replacement-parts demand. Evidence role: mechanism; source type: research. Supports: Fleet size, vehicle age, application composition, and repair behavior are recognized inputs in estimating automotive aftermarket demand.. Scope note: Such research supports the demand-planning framework generally but does not establish sales volumes for a particular brake-caliper application or territory. ↩
"Corrosion Stiction in Automotive Braking Systems - PMC - NIH", https://pmc.ncbi.nlm.nih.gov/articles/PMC10224365/. Engineering studies of automotive braking systems report that moisture, deicing salts, and road contaminants can promote corrosion of exposed brake components and affect their service condition. Evidence role: mechanism; source type: paper. Supports: Moisture, deicing salts, road contaminants, and maintenance conditions can contribute to corrosion and impaired movement of exposed brake components.. Scope note: Evidence about corrosion mechanisms does not by itself quantify regional aftermarket demand or replacement frequency. ↩
"Estimating The Number Of Failures And The Spare Parts Demand", https://research.sabanciuniv.edu/id/eprint/49876/. Service-parts demand models generally treat the installed base as only one input, with realized demand also depending on failure or replacement rates, maintenance behavior, and the timing of service events. Evidence role: mechanism; source type: paper. Supports: Service-parts demand depends on the installed base together with part failure, replacement, maintenance, and channel behavior rather than on installed-base size alone.. Scope note: General service-parts models provide conceptual support but may not capture brake-caliper-specific replacement behavior in a given market. ↩
"Personal Vehicle Ownership and Operating Cost Calculator", https://rosap.ntl.bts.gov/view/dot/64587/dot_64587_DS1.pdf. Transportation and consumer-expenditure data generally show that maintenance and repair needs rise as vehicles age, supporting the use of fleet age as one indicator of aftermarket opportunity. Evidence role: general_support; source type: government. Supports: Older vehicles tend to require more maintenance and repair expenditure or activity than newer vehicles.. Scope note: Age is an aggregate indicator and does not establish that brake calipers, specifically, will require replacement at a predictable mileage or year. ↩
"(DOC) ABC Analysis", https://www.academia.edu/35857934/ABC_Analysis. ABC inventory analysis is based on the recurrent observation that a relatively small class of items can account for a disproportionate share of sales, usage, or annual consumption value. Evidence role: general_support; source type: education. Supports: ABC inventory analysis commonly finds that a minority of items accounts for a large share of sales, usage, or inventory value.. Scope note: The concentration varies by business and dataset, so this principle does not prove that any particular brake-caliper assortment follows a specific percentage split. ↩
"Automotive Parts Ecommerce: The Fitment Data Return ...", https://www.uncap.com/post/automotive-parts-ecommerce-fitment-data-returns. Research and industry standards on automotive product identification emphasize that accurate application and fitment data are necessary to prevent wrong-part selection, avoidable returns, and service delays. Evidence role: mechanism; source type: research. Supports: Accurate vehicle and product identification is necessary to match replacement parts to applications, while identification errors can generate wrong-part orders and returns.. Scope note: General fitment-data evidence supports the causal pathway but may not report brake-caliper-specific return or warranty rates. ↩
"Analyzing Costs Using Total Cost of Ownership", https://psep.smeal.psu.edu/short-courses/supply-chain-accelerator/advanced-procurement-analyzing-costs-using-total-cost-of-ownership. Total-cost-of-ownership research in procurement evaluates suppliers using acquisition price together with logistics, quality, delivery, inventory, transaction, and post-purchase costs. Evidence role: expert_consensus; source type: paper. Supports: Procurement research treats acquisition price as only one component of supplier cost and includes logistics, quality, delivery, inventory, and administrative effects.. Scope note: The framework validates a broader cost comparison but does not establish that every listed cost can be measured precisely for a particular supplier. ↩
"The Impact of Stockouts on Customer Loyalty to Lean Retailers", https://scholarworks.waldenu.edu/dissertations/1011/. Empirical stockout research shows that unavailable products can lead customers to delay purchases, substitute alternatives, or switch sellers, creating costs beyond the immediate missing transaction. Evidence role: general_support; source type: paper. Supports: Stockouts can cause delayed purchases, substitution, lost sales, and switching to another seller or brand.. Scope note: Most stockout studies are context-specific and may not directly quantify reputational effects in business-to-business brake-parts distribution. ↩
"management system certification body", https://iaf.nu/iaf_system/uploads/documents/Why_Use_Accredited_Management__Systems_CB_05012024.pdf. Accreditation guidance treats certificate verification—including confirmation of status, certified organization, site, standard, and scope—as a distinct part of relying on a management-system certification. Evidence role: expert_consensus; source type: institution. Supports: Accreditation and certification bodies provide mechanisms for checking whether management-system certificates are valid, current, and issued for the represented organization and scope.. Scope note: A valid certificate confirms certification to a defined management-system scope; it does not independently prove the quality of every shipment or product. ↩
"Hybrid: Braking", https://afdc.energy.gov/fueleconomy/animations/hybrids/hybrid/hybridbraking2.html. Government technical descriptions of electric vehicles explain that regenerative braking recovers kinetic energy through the electric drivetrain, while conventional friction brakes remain available to provide required deceleration and braking redundancy. Evidence role: mechanism; source type: government. Supports: Electric vehicles recover energy through regenerative braking but still employ friction brakes for additional stopping force, low-speed operation, emergency braking, and redundancy.. ↩
"Research on regenerative braking control of electric vehicles based on ...", https://pmc.ncbi.nlm.nih.gov/articles/PMC11080741/. Engineering studies report that regenerative braking provides a portion of vehicle deceleration, reducing the duty imposed on friction brakes under operating conditions in which energy recovery is available. Evidence role: mechanism; source type: paper. Supports: Regenerative braking supplies part of a vehicle's deceleration and can therefore reduce the frequency or intensity with which friction brakes are applied.. Scope note: The reduction varies with vehicle design, battery state, temperature, driving cycle, and control strategy, so it does not imply a uniform extension of brake-component life. ↩
"Corrosion Stiction in Automotive Braking Systems - PMC - NIH", https://pmc.ncbi.nlm.nih.gov/articles/PMC10224365/. Studies of electrified-vehicle brakes note that lower friction-brake utilization can reduce wear while also permitting corrosion or impaired movement to develop, preserving the need for periodic inspection. Evidence role: mechanism; source type: paper. Supports: Infrequent operation of friction brakes can allow corrosion to develop on braking surfaces or moving components, so inspection remains necessary despite reduced wear.. Scope note: Published findings often concern discs, pads, or complete brake assemblies and may not isolate brake-caliper replacement demand. ↩